

Latest IIBA CBDA PDF and Dumps (2024) Free Exam Questions Answers
Pass Your Business Data Analytics CBDA Exam on May 13, 2024 with 152 Questions
NEW QUESTION # 30
An organization has a customer database of 3000 customers and has accumulated 5 years of sales data. They want to make decisions about which products to retire and which to continue to offer. Management has turned to the analytics team to analyze the data and provide recommendations. The analytics team develops a survey to send to randomly selected customers.This is an example of:
- A. Data Sampling
- B. Data Wrangling
- C. Data Grouping
- D. Data Manipulation
Answer: A
Explanation:
Data sampling is the process of selecting a subset of data from a larger population to represent the characteristics of the whole population. Data sampling is often used when the population is too large or costly to collect data from every individual. Data sampling can help reduce the time, cost, and complexity of data analysis, while maintaining the validity and reliability of the results. Data sampling can also help avoid biases and errors that may arise from collecting data from the entire population. Data sampling can be done using various methods, such as random sampling, stratified sampling,cluster sampling, or convenience sampling, depending on the research objectives and the availability of data. In this example, the analytics team develops a survey to send to randomly selected customers, which is a form of data sampling. The survey aims to collect data from a representative sample of customers that can reflect the preferences and opinions of the entire customer population. The survey data can then be used to analyze the performance and demand of different products, and provide recommendations to management. References:
* [Business Data Analytics: A Practitioner's Guide], Chapter 4: Data Analysis, Section 4.2: Data Sampling, pp. 69-72.
* [A Guide to the Business Analysis Body of Knowledge® (BABOK® Guide)], Version 3, Chapter 6:
Solution Evaluation, Section 6.2: Analyze Performance Measures, pp. 152-153.
NEW QUESTION # 31
An analyst calculates the average, median, and mode values for a dataset.What type of analytics is the analyst performing?
- A. Predictive
- B. Diagnostic
- C. Descriptive
- D. Prescriptive
Answer: C
Explanation:
Descriptive analytics is the type of analytics that summarizes and visualizes data to provide an overview of what has happened or is happening. Descriptive analytics uses techniques such as statistics, charts, graphs, and dashboards to display data in an understandable and meaningful way. Descriptive analytics can help analysts explore data, identify patterns, and communicate insights. Calculating theaverage, median, and mode values for a dataset is an example of descriptive analytics, as it provides a measure of central tendency for the data distribution. References:
* Certification in Business Data Analytics (IIBA ® - CBDA), IIBA, accessed on January 20, 2024.
* Business Data Analytics Certification - CBDA Competencies | IIBA®, IIBA, accessed on January 20,
2024.
* Guide to Business Data Analytics, IIBA, 2020, p. 15.
* The 4 Types Of Analytics Explained (With Examples), Analytics for Decisions, accessed on January 20,
2024.
NEW QUESTION # 32
A professional association is funded by membership fees. The membership renewal occurs every 5 years.
Although, they have a strong subscription rate each year, their renewal rate is low. They are working with an external firm specializing in Business Analytics to identify the groups of customers that have a high likelihood of cancelling their subscription after their first 5-year term ends. This type of study is called:
- A. Unsupervised learning
- B. Untrained learning
- C. Trained learning
- D. Supervised learning
Answer: A
Explanation:
Explanation
Unsupervised learning is a type of study that involves finding patterns or clusters in data without any predefined labels or outcomes. It is useful for exploring data and discovering hidden structures or groups of customers. For example, the professional association can use unsupervised learning to identify the characteristics of customers who are likely to cancel their subscription after their first 5-year term ends, and then design strategies to retain them12 References: 1: What is Unsupervised Learning? - IBM 2: Unsupervised Learning - IIBA BABOK Guide v3
NEW QUESTION # 33
DIAGRAM TAKEN
A data scientist is analyzing a dataset to determine if there is a strong relationship between twovariables. A measure of covariance is done. Which of the following graphs indicate Zero Covariance between variables?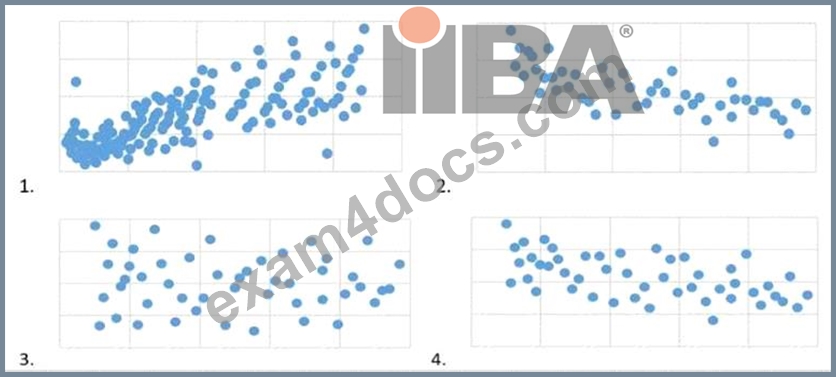
- A. 0
- B. 1
- C. 2
- D. 3
Answer: D
Explanation:
In the context of Business Data Analytics (IIBA®- CBDA), zero covariance between two variables indicates that there is no linear relationship between those variables. When the covariance is zero, it means the variables are independent of each other. In the provided options, graph 4 shows a random scatter of data points without any apparent trend or pattern, indicating zero covariance.
References: The explanation is in alignment with the concepts and principles outlined in IIBA's resources on Business Data Analytics, particularly focusing on statistical analysis and data interpretation.
NEW QUESTION # 34
An analytics team is interested in reviewing the results of a public opinion poll that is going to be conducted at the end of the month. One of the factors the team is interested in, is ensuring the result set is statistically significant. Why would this factor be important to the team?
- A. Ensure that results are not biased or random
- B. Guarantee that the objectives of the poll are met
- C. To make sure the criteria for the target audience is met
- D. Improve the likelihood of receiving a response rate of 100%
Answer: A
Explanation:
Ensuring the result set is statistically significant is important to the team because it means that the difference or relationship observed in the data is unlikely to be due to chance or sampling error. Statistical significance helps the team to assess the validity and reliability of their findings, and to draw meaningful conclusions and recommendations from the data. Statistical significance also helps the team to communicate their results with confidence and credibility to the stakeholders and decision makers12 References: 1: An Easy Introduction to Statistical Significance (With Examples) - Scribbr 2: Statistical Significance in Experimentation and Data Analysis - All About Circuits
NEW QUESTION # 35
An analyst is interested in providing a visual diagram to compare and contrast the characteristics of four different solution options. Each option should be represented by their cost, value, and risk level. What type of chart would accomplish this task?
- A. Bubble
- B. Waterfall
- C. Bullet
- D. Pie
Answer: A
Explanation:
A bubble chart is a type of chart that displays three dimensions of data: the x-axis, the y-axis, and the size of the bubble. A bubble chart can be used to compare and contrast the characteristics of different solution options by plotting their cost, value, and risk level on the three axes. For example, a solution option with a high cost, high value, and low risk would be represented by a large bubble on the upper left corner of the chart, while a solution option with a low cost, low value, and high risk would be represented by a small bubble on the lower right corner of the chart. A bubble chart can help the analyst and the stakeholders to visualize the trade-offs and benefits of each solution option and to select the most optimal one based on the business objectives and constraints. References: Guide to Business Data Analytics, page 77; Introduction to Business Data Analytics:
A Practitioner View, page 16; [Business Data Analytics: A Practical Guide], page 121.
NEW QUESTION # 36
The analytics team has been asked to assess sales data from their company's website with the hopes of providing insights to help increase online sales. It's the first time the team is looking at this specific data and they are concerned about the quality of data that has been captured. They decide to use the following approach as the next step:
- A. Classification analysis
- B. Data Analysis
- C. Exploratory analysis
- D. Trend Analysis
Answer: C
Explanation:
Explanation
Exploratory analysis is the approach that the analytics team should use as the next step, because it is a technique that allows them to examine the quality, structure, and characteristics of the data, without making any assumptions or hypotheses. Exploratory analysis can help the team identify any issues or anomalies in the data, such as missing values, outliers, or errors, and decide how to handle them. Exploratory analysis can also help the team discover any patterns, trends, or relationships in the data, and generate new research questions or hypotheses for further analysis. References:
*Business Analysis Certification in Data Analytics, CBDA | IIBA®, CBDA Competencies, Domain 3:
Analyze Data
*Understanding the Guide to Business Data Analytics, page 16
*CERTIFICATION IN BUSINESS DATA ANALYTICS HANDBOOK - IIBA®, page 8, CBDA Exam Sample Questions and Self-Assessment, Question 8
NEW QUESTION # 37
A colleague proposes measuring job satisfaction by asking the question "What is your salary?". What is the concerning factor about this question?
- A. Reproducibility
- B. Clarity
- C. Subjectivity
- D. Validity
Answer: D
Explanation:
Validity is the extent to which a measure or a question accurately captures the intended concept or construct1.
The question "What is your salary?" is not a valid measure of job satisfaction, as it does not reflect the various aspects of job satisfaction, such as work environment, recognition, autonomy, growth, etc. Salary is only one possible factor that may influence job satisfaction, but it is not a direct or comprehensive indicator of it23.
Therefore, the question is not valid for measuring job satisfaction. References: 1: Guide to Business Data Analytics, IIBA, 2020, p. 302: Job Satisfaction: Application, Assessment, Causes, and Consequences, Paul E.
Spector, 1997, p. 23: Job Satisfaction Survey, 1.
NEW QUESTION # 38
A job satisfaction study is being considered. Half of the employees of the company will be interviewed by senior managers and the other half of the employees will be interviewed by an external market research company, using the same set of questions. Which of the following might be a concern for using this approach to collect study data?
- A. Precision
- B. Reliability
- C. Timeliness
- D. Validity
Answer: B
Explanation:
Reliability is the degree to which a data collection method produces consistent results under the same conditions1. In this case, the reliability of the study data might be compromised by the different interviewers (senior managers vs. external market research company), who might have different biases, expectations, or rapport with the employees. This could affect how the employees respond to the same set of questions, and thus introduce variability in the data. Validity, timeliness, and precision are not directly affected by the choice of interviewers, as they depend more on the quality, relevance, and accuracy of the questions and the data analysis. References: 1: Guide to Business Data Analytics, IIBA, 2020, p. 26.
NEW QUESTION # 39
The analytics team has completed analyzing a dataset and unfortunately the data didn't deliver the kinds of insights that the team was hoping for. After much contemplation, they decide to:
- A. Restart the work with formation of a new research question
- B. Summarize the results and indicate the outcome was inconclusive
- C. Wait a few weeks and rerun the analysis using refreshed data
- D. Inform management that analytics could not derive insightful results
Answer: A
Explanation:
The analytics team should restart the work with formation of a new research question, because the existing one may not be well-defined, relevant, or feasible. A well-formed research question is the first step of the business data analytics cycle, and it guides the subsequent steps of sourcing, analyzing, interpreting, and reporting data.
If the data analysis does not yield meaningful insights, the team should revisit the research question and refine it based on the business problem, stakeholder needs, data availability, and analytical methods. References:
*Understanding the Guide to Business Data Analytics, page 10-11
*Business Analysis Certification in Data Analytics, CBDA | IIBA®, CBDA Competencies, Domain 1: Identify the Research Questions
*CERTIFICATION IN BUSINESS DATA ANALYTICS HANDBOOK - IIBA®, page 8, CBDA Exam Sample Questions and Self-Assessment, Question 5
NEW QUESTION # 40
To gain traction on online sales, a retailer initiated a marketing campaign using banner ads. The company has requested their analytics team to evaluate the performance of the campaign. During the presentation, the analyst confirmed that the campaign did bring in a large number of net new customers to the website and met the target sales conversion rate. They also noted that there was a high number of repeat visitors not completing a sale. What decision would help the retailer improve sales conversion rates for repeat visitors?
- A. Increase investment in banner ads
- B. Add additional new products to attract customers
- C. Incentivize customers to subscribe to promotional notifications
- D. Ensure the sales checkout process is streamlined
Answer: D
Explanation:
According to the Business Data Analytics: A Decision-Making Paradigm1, one of the key steps in the analytics process is to communicate insights and recommendations to stakeholders. The analyst should present the findings in a clear and concise manner, and provide actionable suggestions to improve the business outcomes. In this case, the analyst has identified that repeat visitors are not completing a sale, which indicates a possible issue with the sales checkout process. Therefore, the analyst should recommend the retailer to streamline the sales checkout process, which could reduce friction, increase customer satisfaction, and boost sales conversion rates for repeat visitors. References: Business Data Analytics: A Decision-Making Paradigm
NEW QUESTION # 41
Collaborative games are used by a business analyst to identify the research questions to be explored within an analytics system.
Participants are asked to write down a research question on a sticky note, put the notes on the wall,and move them towards related research questions. What type of Collaborative game is being played?
- A. People polling
- B. Fishbowl
- C. Affinity Map
- D. Product Box
Answer: C
Explanation:
An affinity map is a collaborative game that helps participants to group similar ideas or features together. It is useful for identifying research questions that are related to each other and finding common themes or patterns.
In this game, participants write down their research questions on sticky notes and place them on the wall.
Then, they move the notes around to form clusters of related questions. The clusters can be labeled with a descriptive name or a question that summarizes the theme. An affinity map can help participants to prioritize the most important or relevant research questions and generate insights from the data.
https://businessanalystmentor.com/collaborative-games-business-analysis/
NEW QUESTION # 42
The results of the data analytics work led to some clear and strongly supported outcomes and the analytics team is very confident in their recommendations; particularly given that the payback on the required changes are a short 3 months. However, there is concern because the organization operates in a highly regulated environment and some new regulatory changes are being considered with announcements and implementation in the next 6 months. Under these conditions the team decides to:
- A. Reassess their results to ensure their validity and then decide what to do
- B. Identify and carefully document assumptions for their recommendation
- C. Postpone recommendations for 6 months until the announcements are made
- D. Recommend no action be taken at this time and revisit in 6 months
Answer: B
Explanation:
Explanation
The best option for the team under these conditions is to identify and carefully document the assumptions for their recommendation, such as the expected impact of the regulatory changes, the risks and benefits of implementing the changes before or after the announcements, and the sensitivity of the results to different scenarios. This way, the team can communicate their findings and recommendations clearly and transparently, while also acknowledging the uncertainty and limitations of their analysis. This can help the decision makers to evaluate the trade-offs and make informed choices12. References: 1: Guide to Business Data Analytics, IIBA, 2020, p. 242: Data-Driven Decision Making: A Primer for Beginners, Anand Rao, 2018, 1.
NEW QUESTION # 43
A data scientist is working with a team of upper level managers to develop a strategy for creating an enterprise analytics program. What critical success factor would help ensure the organization obtains the most value from its data?
- A. A sponsor is identified that helps champion the work
- B. Management thinks analytically and fosters a culture where data science thrives
- C. Management is aware of the value of data science and ensures support for all tactical initiatives
- D. The data science team supports the functional units and priorities
Answer: B
Explanation:
According to the Introduction to Business Data Analytics: An Organizational View, one of the critical success factors for creating an enterprise analytics program is to have a management team that thinks analytically and fosters a culture where data science thrives. This means that the management team should understand the potential value and impact of data science, promote a data-driven mindset and decision-making process, encourage innovation and experimentation, and support collaboration and learning among the data science team and other stakeholders. A management team that thinks analytically and fosters a culture where data science thrives can help create a strategic vision, align the goals and objectives, allocate the resources and investments, and overcome the challenges and barriers for the enterprise analytics program.
References: Introduction to Business Data Analytics: An Organizational View, page 8-9; CBDA Exam Blueprint, page 8; Guide to Business Data Analytics, page 85-86.
NEW QUESTION # 44
An analyst is performing regression analysis and reviewing the results. They would like to rescale the variables in the model to more clearly reflect the relationship between the regression coefficients.Which technique could be used to rescale the variables?
- A. Dimension Reduction
- B. Normalization
- C. Mean Centering
- D. Clustering
Answer: B
Explanation:
Normalization is a technique that rescales the values of the variables in a data set to a common range, such as
[0,1] or [-1,1]. Normalization can help reduce the effect of outliers, improve the performance of some algorithms, and make the interpretation of the regression coefficients easier and more consistent.
Normalization can be done using different methods, such as min-max scaling, z-score scaling, or unit vector scaling.
References:Guide to Business Data Analytics, page 41; Introduction to Business Data Analytics: A Practitioner View, page 12.
NEW QUESTION # 45
While creating a dataset for analysis, the analyst reviews the data collected and finds a large percentage of records are missing values. Which activity would the analyst perform in order to use this dataset?
- A. Factor analysis
- B. Weighting
- C. Clustering
- D. Scale validation
Answer: B
Explanation:
Explanation
Weighting is a technique that assigns different values or weights to different records or variables in a dataset, based on their importance or relevance. Weighting can be used to handle missing values by giving them a lower weight or imputing them with a weighted average of other values. Weighting can also help to adjust for sampling bias or non-response bias in the data collection process. References:
*Understanding the Guide to Business Data Analytics, page 16
*Business Analysis Certification in Data Analytics, CBDA | IIBA®, CBDA Competencies, Domain 3:
Analyze Data
*CERTIFICATION IN BUSINESS DATA ANALYTICS HANDBOOK - IIBA®, page 8, CBDA Exam Sample Questions and Self-Assessment, Question 4
NEW QUESTION # 46
There were 7 students enrolled in the Introduction to Artificial Intelligence course. These were the student's scores from the final exam: 64, 70, 80, 80, 90, 98, 100 What is the mean and mode for the outlined scores?
- A. 79.84, 81.40
- B. 80, 83.14
- C. 80,80
- D. 83.14, 80
Answer: D
Explanation:
Explanation
The mean is the average of all the scores, which is found by adding them up and dividing by the number of scores. The mode is the most frequent score, which is the one that occurs the most times. To find the mean and mode for the outlined scores, we can use the following steps:
*Arrange the scores in ascending order: 64, 70, 80, 80, 90, 98, 100
*Add up the scores: 64 + 70 + 80 + 80 + 90 + 98 + 100 = 582
*Divide the sum by the number of scores: 582 / 7 = 83.14
*The mean is 83.14
*Count how many times each score occurs: 64 occurs once, 70 occurs once, 80 occurs twice, 90 occurs once,
98 occurs once, 100 occurs once
*The score that occurs the most times is 80
*The mode is 80
Therefore, the mean and mode for the outlined scores are 83.14 and 80, respectively12 References: 1: Mean, median, and mode review (article) | Khan Academy 2: Mean, Median, and Mode: Measures of Central Tendency - Statistics By Jim
NEW QUESTION # 47
While sourcing data, an analyst runs into a situation where different business units are usingdifferent names to refer to the same data element. This lack of standardization is resulting in confusion and additional time required to properly prepare data for analysis. Which practice, if implemented would address this situation and mature the organization's business analytics practice?
- A. Meta data management
- B. Data quality management
- C. Database operations management
- D. Data warehousing
Answer: A
Explanation:
Meta data management is the practice that, if implemented, would address the situation and mature the organization's business analytics practice, because it is a technique that involves defining, documenting, and maintaining the information about the data elements, such as their names, definitions, formats, sources, and relationships. Meta data management can help the analyst resolve the inconsistencies and ambiguities in the data element names, and ensure that the data is standardized, consistent, and understandable across different business units. Meta data management can also help the analyst improve the data quality, accessibility, and usability for the analysis. References:
*Business Analysis Certification in Data Analytics, CBDA | IIBA®, CBDA Competencies, Domain 2: Source Data
*Guide to Business Data Analytics - Iiba - Google Books, page 14
*Business Data Analytics (IIBA®-CBDA Exam preparation) | Udemy, Section 2: Source Data, Lecture 8:
Meta Data Management
NEW QUESTION # 48
The architecture team puts forth a solution architecture that integrates multiple data sources from within and outside the organization. The architecture provides the foundation to source a new analytics program. If one of the objectives of the analytics team was to provide 'one source of the truth', this objective would be referring to which of the following?
- A. Ensuring stakeholders always have clear insight into the final requirements at all times
- B. Identifying one key stakeholder, who can make final decisions about which sources to relate/merge
- C. Evaluating the completeness, validity, and reliability of the data from source systems
- D. Enforcing master data management principles and practices
Answer: D
Explanation:
Providing 'one source of the truth' means ensuring that there is a single, consistent, and authoritative source of data that can be used for analytics and decision making across the organization. This objective can be achieved by enforcing master data management principles and practices, which involve defining, governing, and maintaining the quality and integrity of the core data entities that are shared by multiple systems and processes. Master data management helps to eliminate data silos, reduce data duplication and inconsistency, and improve data accuracy and reliability12 References: 1: What is Master Data Management (MDM)? - Informatica 2: Master Data Management - IIBA BABOK Guide v3
NEW QUESTION # 49
......
CBDA Dumps for Business Data Analytics Certified Exam Questions and Answer: https://www.exam4docs.com/CBDA-study-questions.html
CBDA Free Exam Study Guide! (Updated 152 Questions): https://drive.google.com/open?id=1sMvoMXojyHAHLYtWYLpC7dl6odVZjJuA
